Written by Sanjeev NC on May 29, 2018
Service desk leaders are struggling with data today. It’s not because they don’t have data; it’s because they can’t draw meaningful insights from it. We realised something important in conversations with our customers.
Currently, they are dependant on expensive BI tools to build a report they want. BI tools aren’t just expensive, they are also have a steep learning curve along and require training.
We wanted to build a module where service desk leaders can quickly see important metrics in their service desk and swiftly act upon it. In other words, less time building reports, more time acting on valuable insights to better your service management operations.
Introducing the new Analytics module in Freshservice to enable swift creation of reports to power decision making in your Service Desk.
Search for the reports
In this consumerized age of instant gratification, search is a default behaviour for most people. With our pre-generated widgets in Freshservice, you can get started by simply searching.

Want to see a metric? Simply search for it, drag into your report and you’re on your way. No need to worry about picking the right data set or choosing the perfect chart, Freshservice does it for you.
A single screen for different widgets
Most of the reporting modules lets you build any report that you want but it renders that to you on a different page. You will have to keep changing tabs to see different metrics. Who wants to do that?

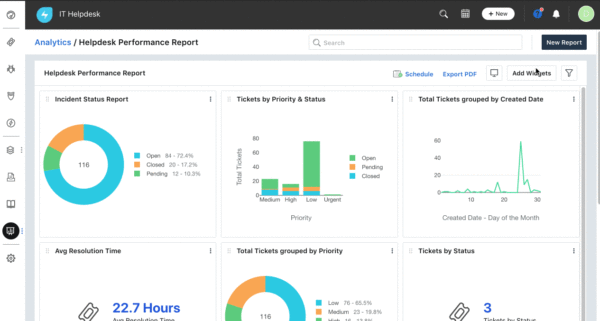
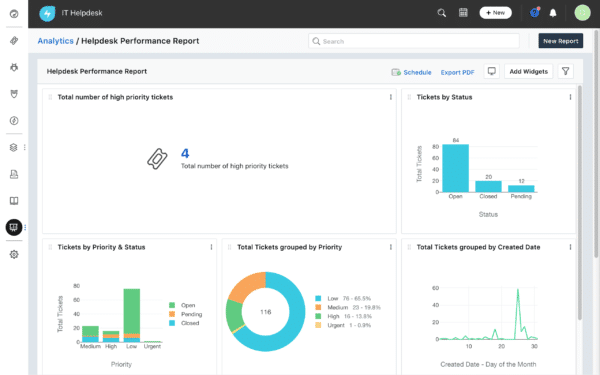
In the Analytics module, you can hand pick the widgets you want to see on a report. You can also resize your widgets within a report so the most important metrics is always the focus.
Another theme we kept coming across in our customer conversations is that IT teams like to be on top of key metrics like “Tickets due today”, “High Priority Tickets”. They usually project such metrics on a large television screen near the team so they can quickly jump to action when the numbers don’t go their way (or celebrate when they do). To enable our customers to do this, we let our widgets be expanded out to a full screen view.
Deep dive into your reports
Imagine looking at a report that shows you 40 tickets have breached SLA. Now imagine building another report to just determine how many of those are high priority tickets. Annoying, right?

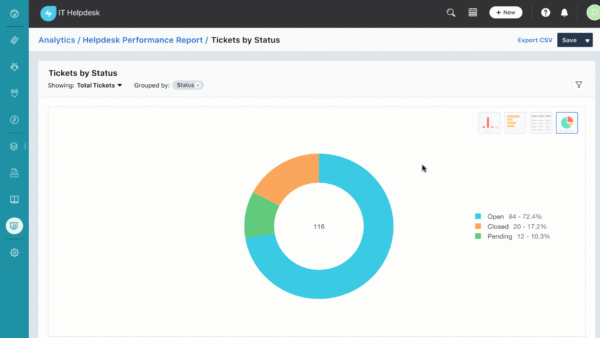
In the Analytics module, you’ll be able to interact with your reports rather than just look at them. You will be able to further drill down into the reports until you find the insight you want.
The road ahead
We believe that search driven analytics is the way forward and we’ll work on making the search very powerful in the next iterations.
While we understand that no out of box reporting can meet every organisations’ need, our marketplace will always serve as a platform that connects Freshservice to other BI tools with our powerful APIs
In summary, Freshservice is committed to make life easy for Service desks and we really want IT Agents & Admins to derive maximum value out of Freshservice directly. Our reason to build a strong reporting module is justified if it negates the need to integrate with an external BI tool.
Powerful insights are needed for every IT team to improve their service delivery. However, if you’re spending hours trying to build a report just to see how long your team takes to get back to a customer then there’s something definitely wrong. As a team, solving customer problems should your prime focus. Generating reports are much simpler; leave that to us.


